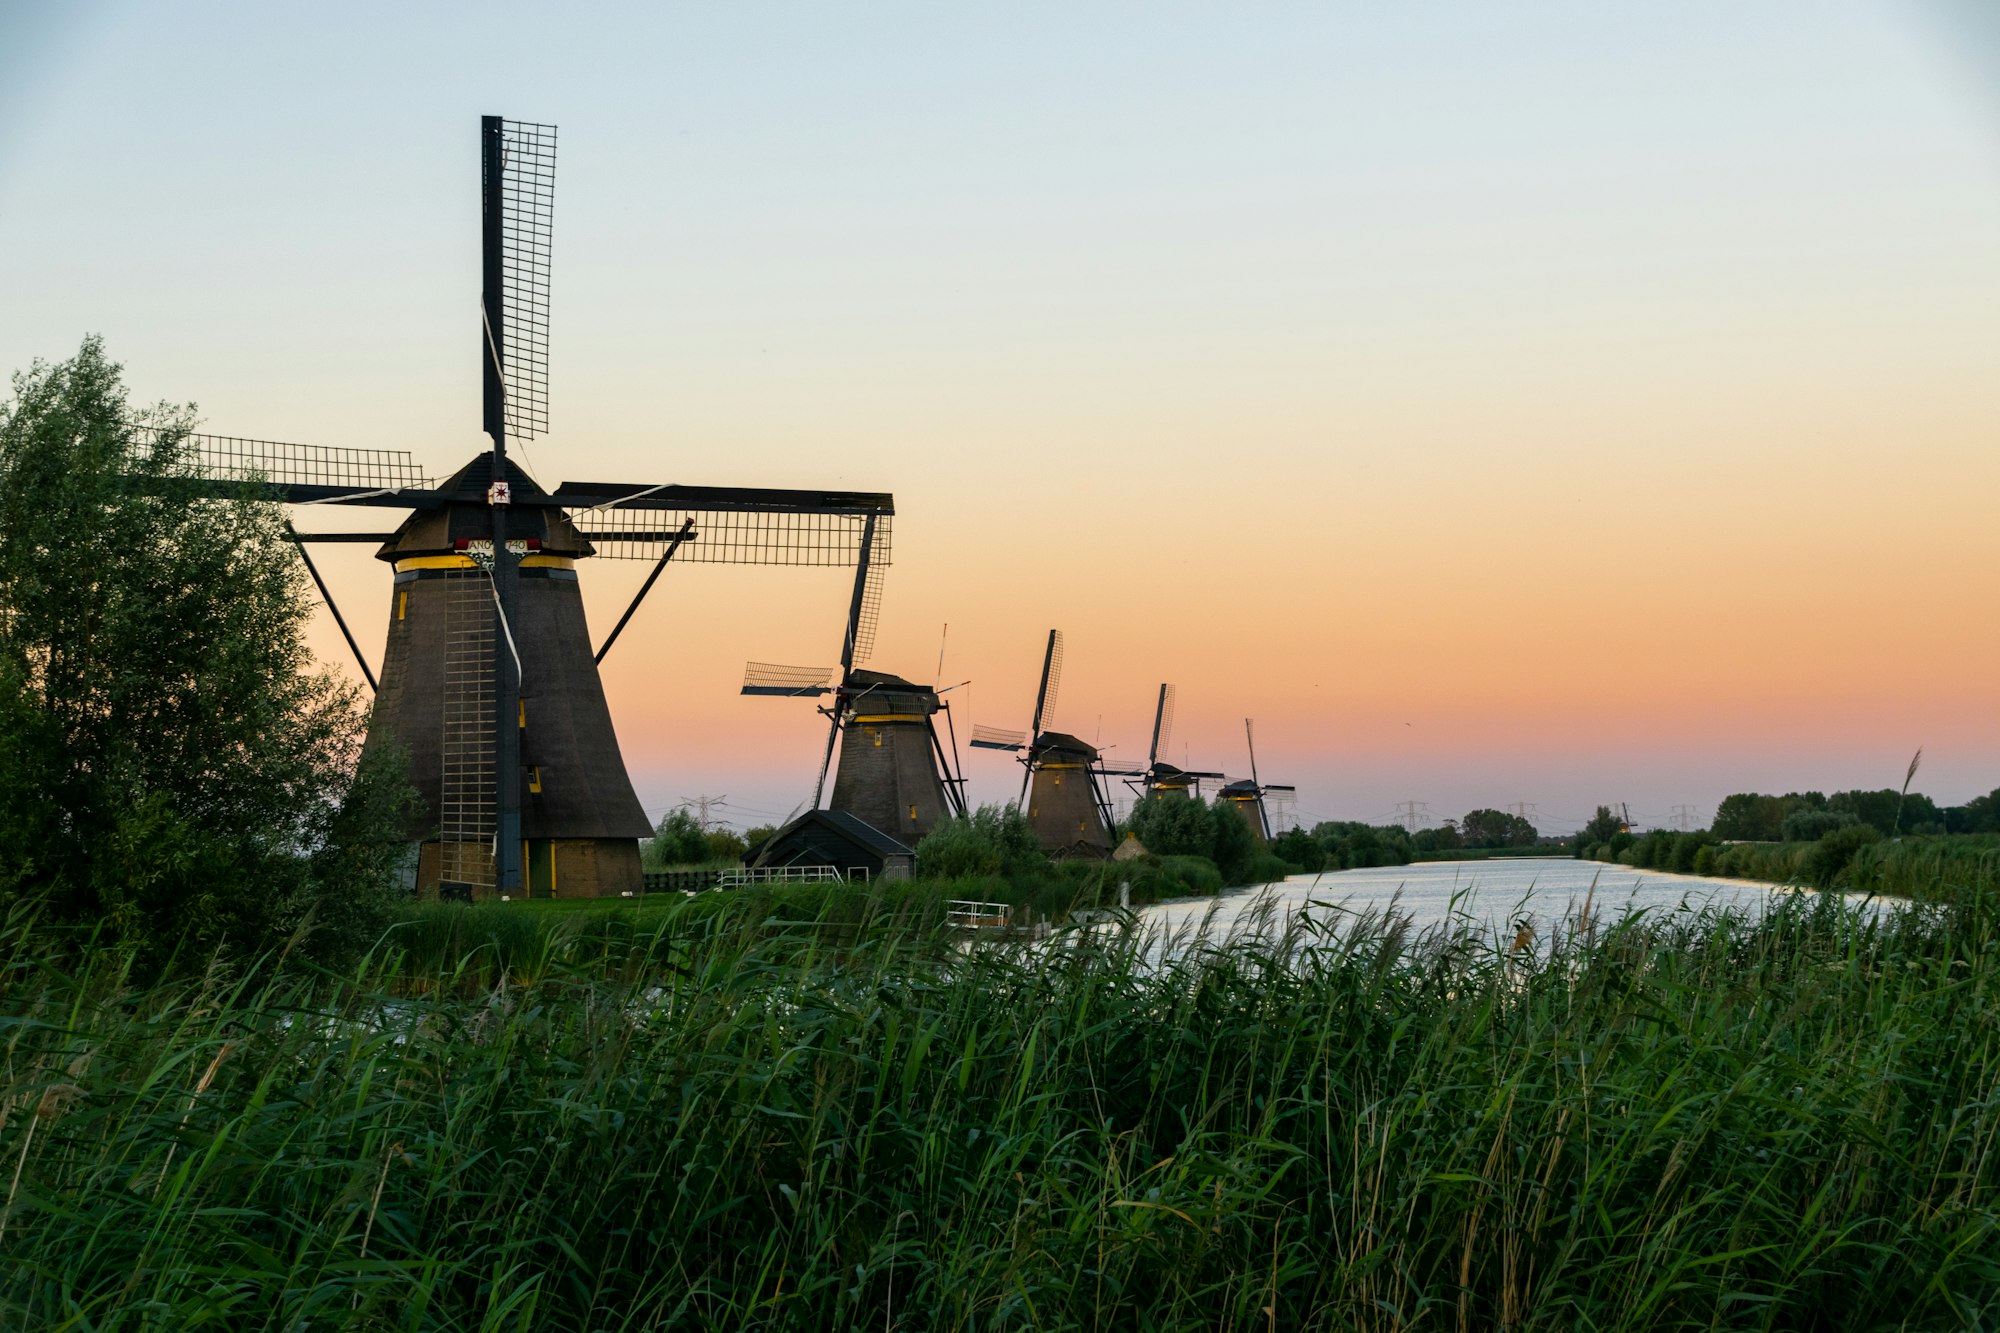
Ferryu lists 1 ferry route to Hook of Holland.
Ferries arrive in Hook of Holland from Harwich, with Stena Line.
Pick a route to see the operators I list on it and where to book with them.
Ferries to Hook of Holland
Crossings from and to Hook of Holland
Weather in Hook of Holland
- Warmest month: August, average high 21°C.
- Wettest month: August, about 79 mm of rain.
- Sea at its warmest in August, about 20°C.
Temperature
- Air, average daily low to high (1991–2020)
- Sea surface, monthly average (2023–2024)
Rain
Average total for the month, mm (1991–2020)
Temperature
- Air, average daily low to high (1991–2020)
- Sea surface, monthly average (2023–2024)
Rain
Average total for the month, mm (1991–2020)
Show the numbers
| Month | High °C | Low °C | Rain mm | Sea °C |
|---|---|---|---|---|
| January | 6.0 | 2.4 | 64.1 | 6.5 |
| February | 6.4 | 2.2 | 51.9 | 6.9 |
| March | 9.1 | 3.8 | 51.1 | 7.8 |
| April | 12.7 | 6.0 | 44.0 | 10.1 |
| May | 16.0 | 9.3 | 56.4 | 13.9 |
| June | 18.6 | 12.0 | 58.5 | 17.5 |
| July | 20.8 | 14.4 | 73.4 | 19.2 |
| August | 21.0 | 14.5 | 78.6 | 20.1 |
| September | 18.2 | 12.3 | 74.5 | 19.4 |
| October | 14.2 | 9.1 | 77.0 | 15.6 |
| November | 9.9 | 5.8 | 72.4 | 11.5 |
| December | 6.8 | 3.2 | 75.2 | 8.0 |
1991–2020 averages, ERA5 via Open-Meteo, read at the grid point nearest the port (8 km away). Sea surface: 2023–2024 averages from the Open-Meteo Marine Weather API, which has no sea temperatures before late 2022.
Reading for Hook of Holland
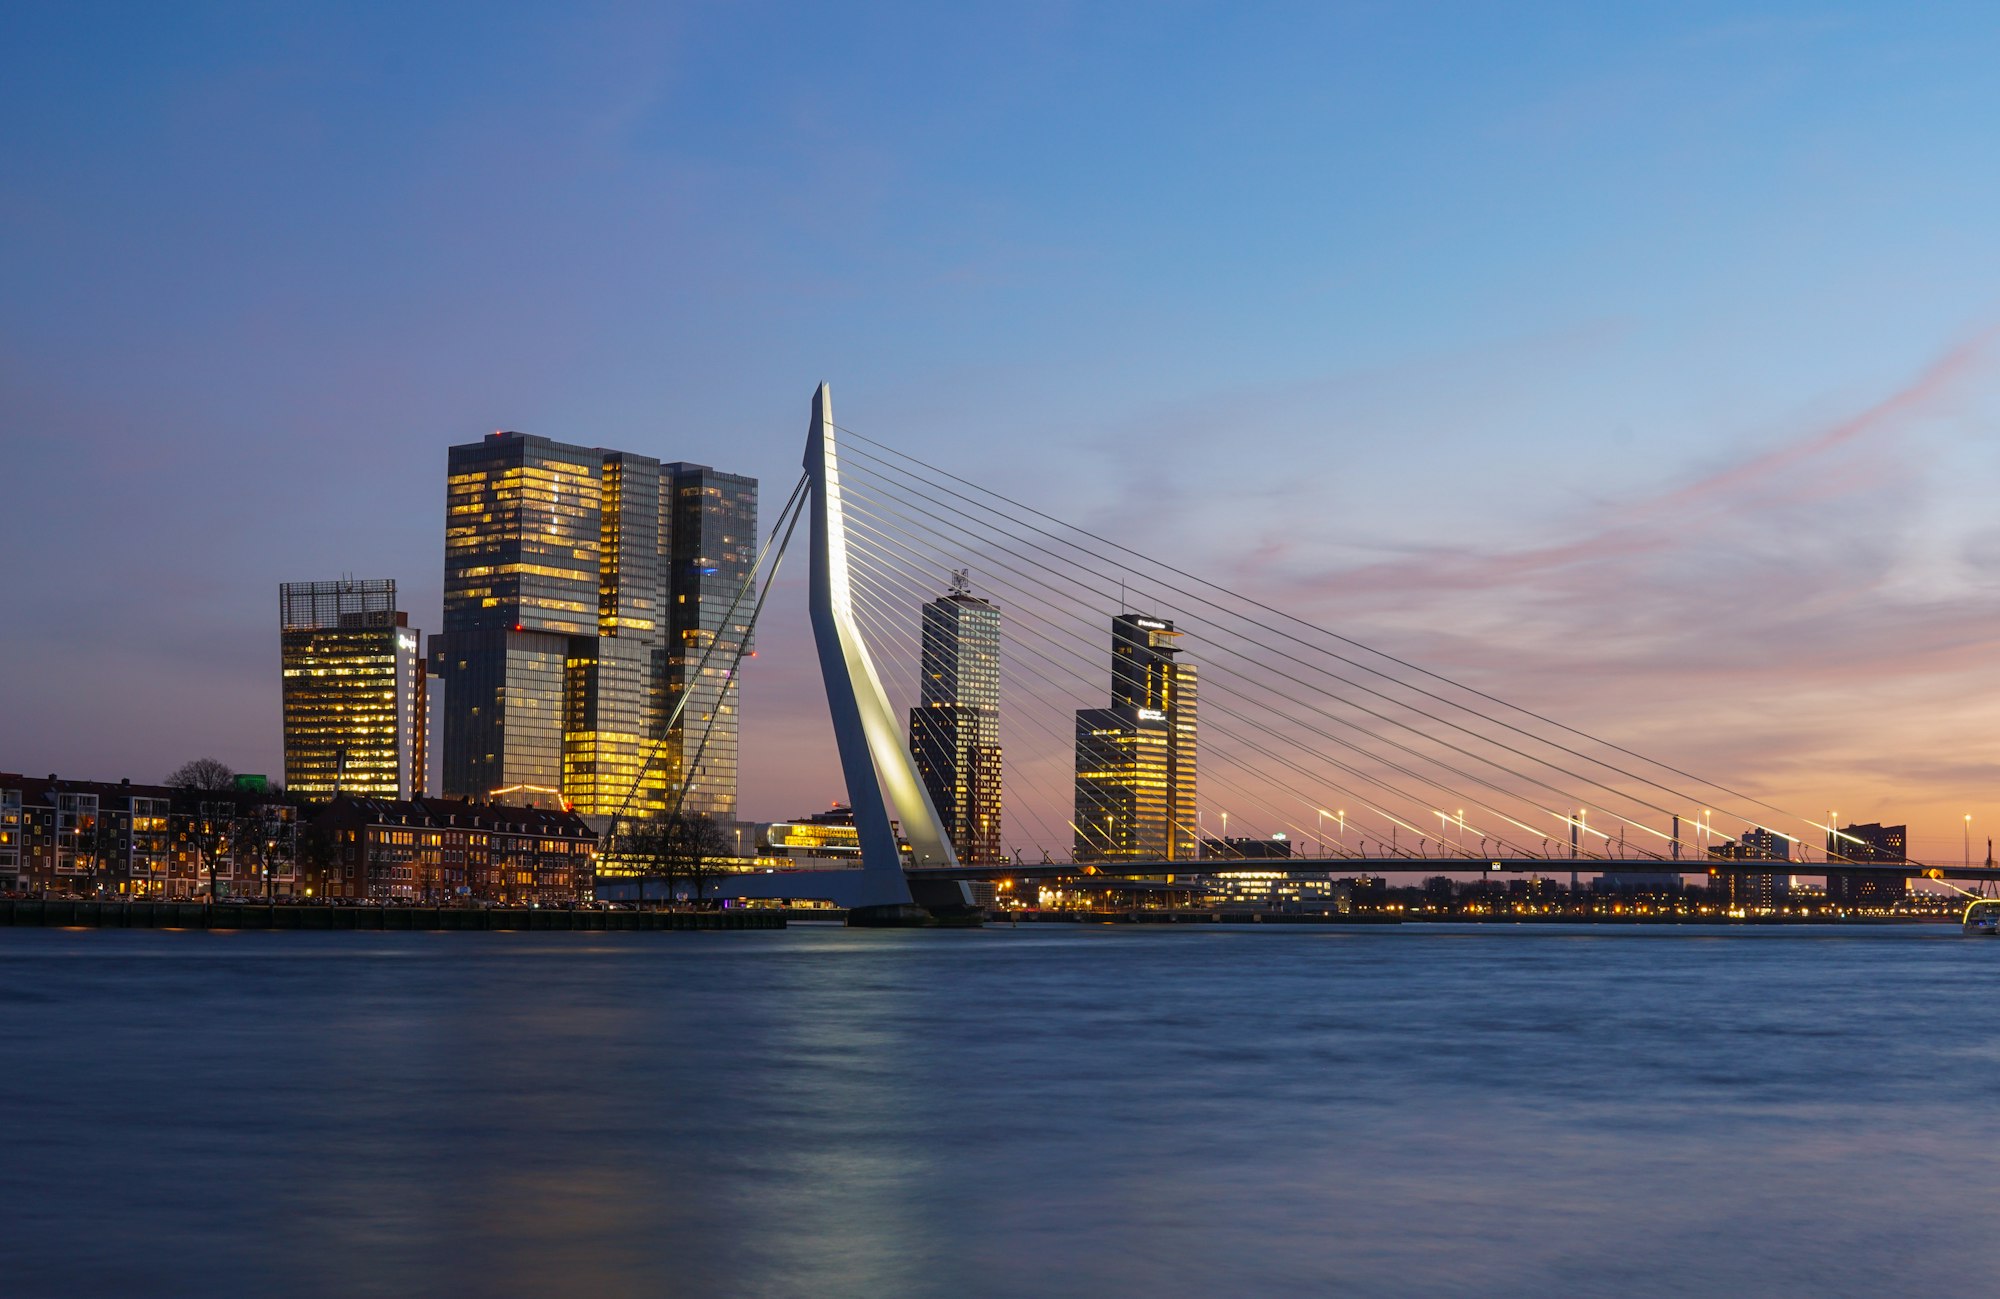
Ferries to Holland
Every ferry route from England to Holland I list, side by side: crossing times, sailings and the ports at each end, from the operators' own sites.
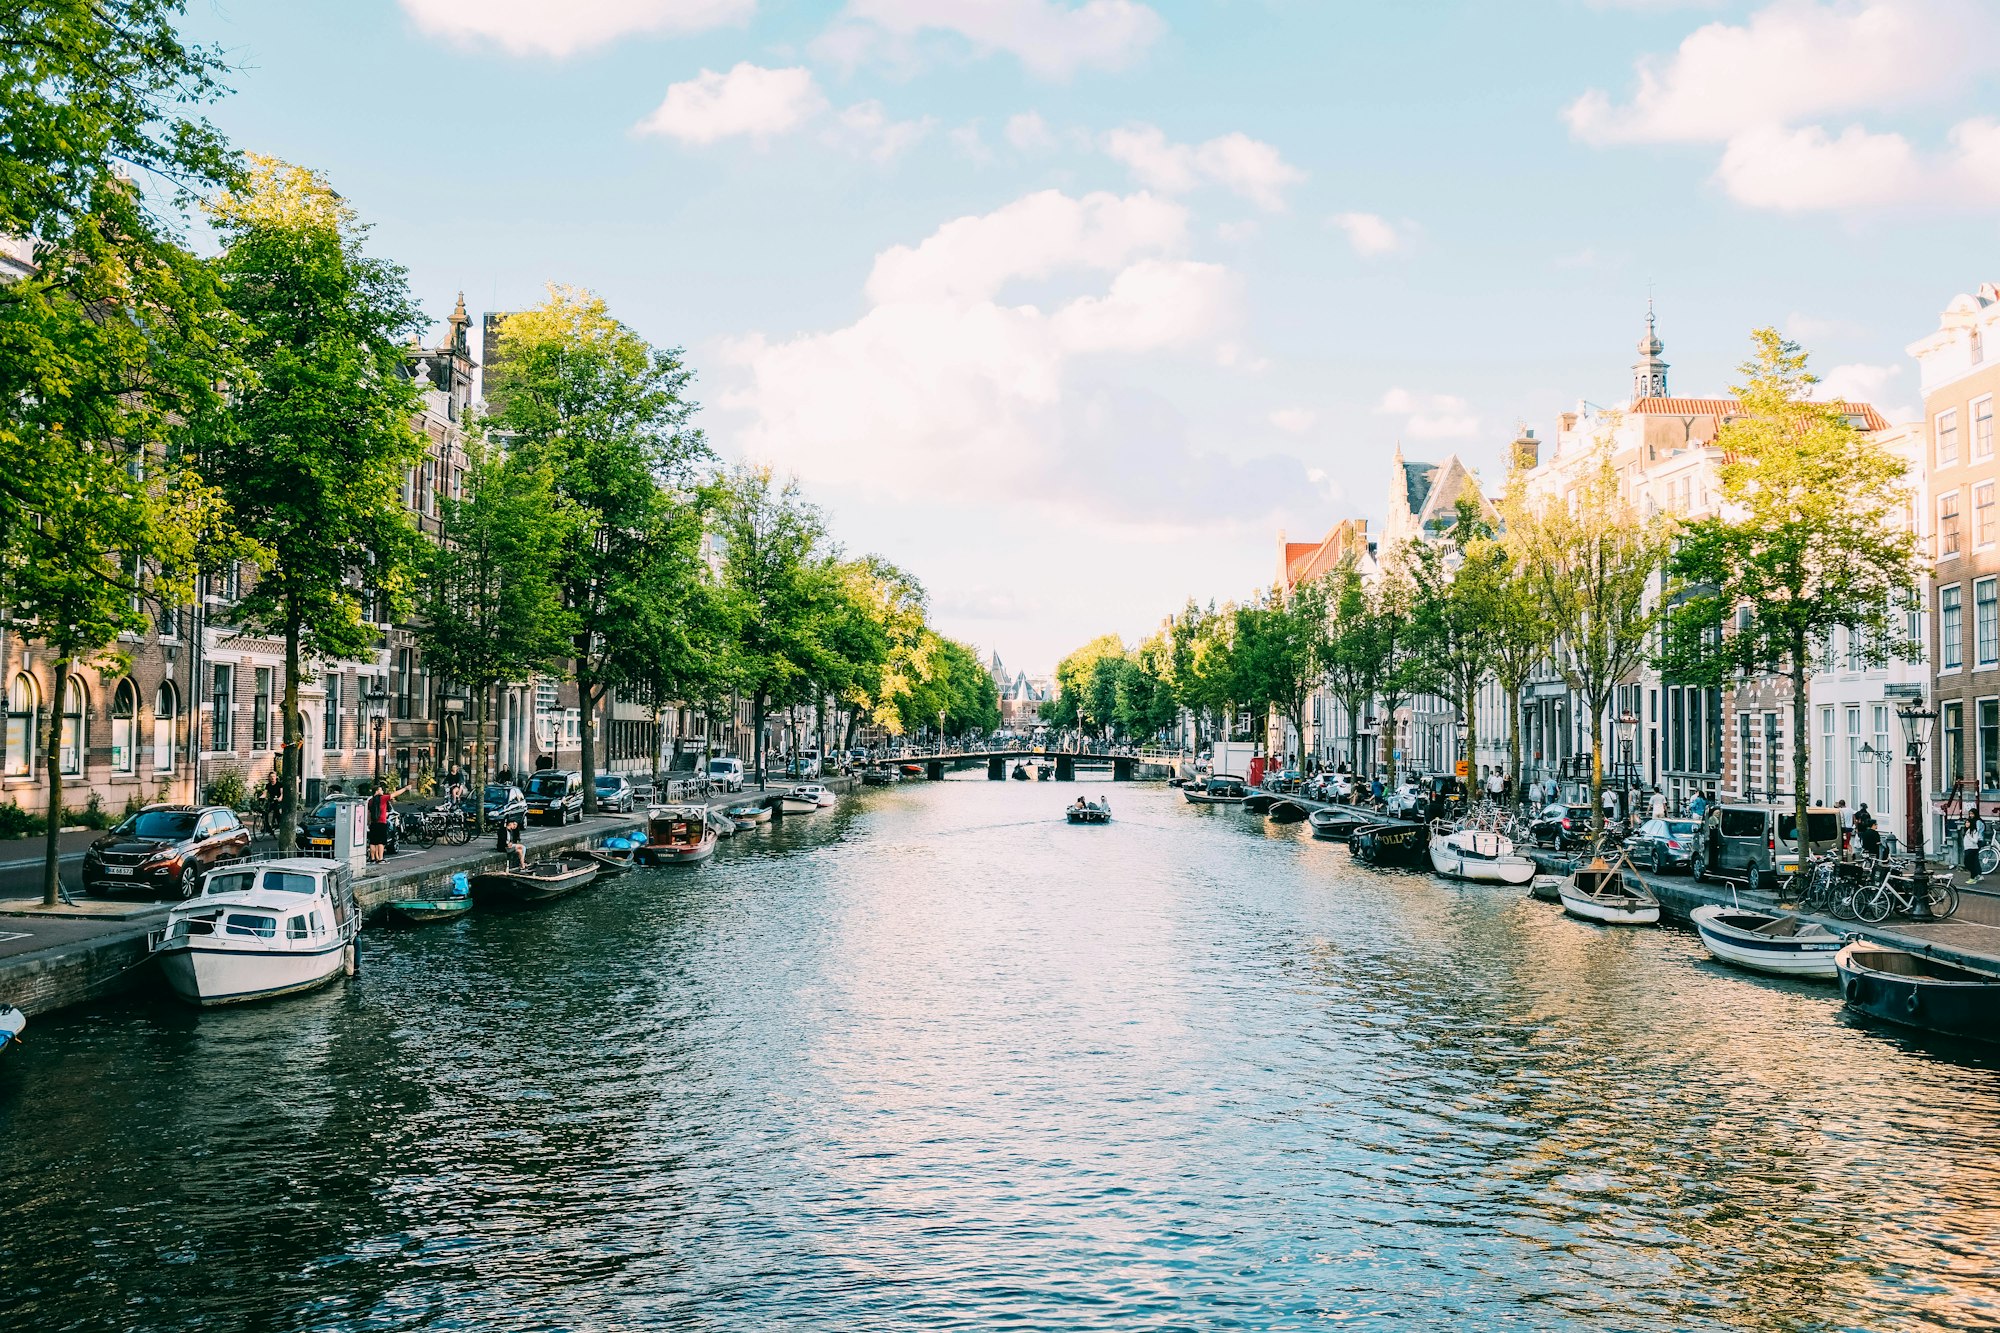
Amsterdam Mini Cruise from Newcastle
The DFDS Amsterdam mini cruise from Newcastle: the two-night timetable, what's included, the coach into Amsterdam, cabins, the ships, and parking at North Shields. From DFDS's own pages, checked 10 November 2026.